 Skip to main content
There is nothing more advantageous than avoiding an accident altogether—brakes are the heart of vehicle safety.
Since safety is one of the most crucial vehicle metrics for consumers, automotive manufacturers must pay special attention to systems that help improve the safety of their vehicles. Because most brakes provide stopping power by converting kinetic energy into thermal energy and dissipating it via rapid rates of heat transfer, understanding where the heat is transferred and what temperature distributions occur when driving is critical.
Optimize Brake Thermal Management
Optimizing brake systems is no easy task—but it can be made more efficient with a verified simulation approach. Our team of engineers has extensive experience in developing thermal simulation strategies for brakes. We understand the delicacy of inevitable trade-offs as well as the hard and fast requirements. Using your specific brake design and operating conditions, we can develop a thermal management strategy that improves safety and meets warranty obligations.
Transient Simulation for Real-World Results
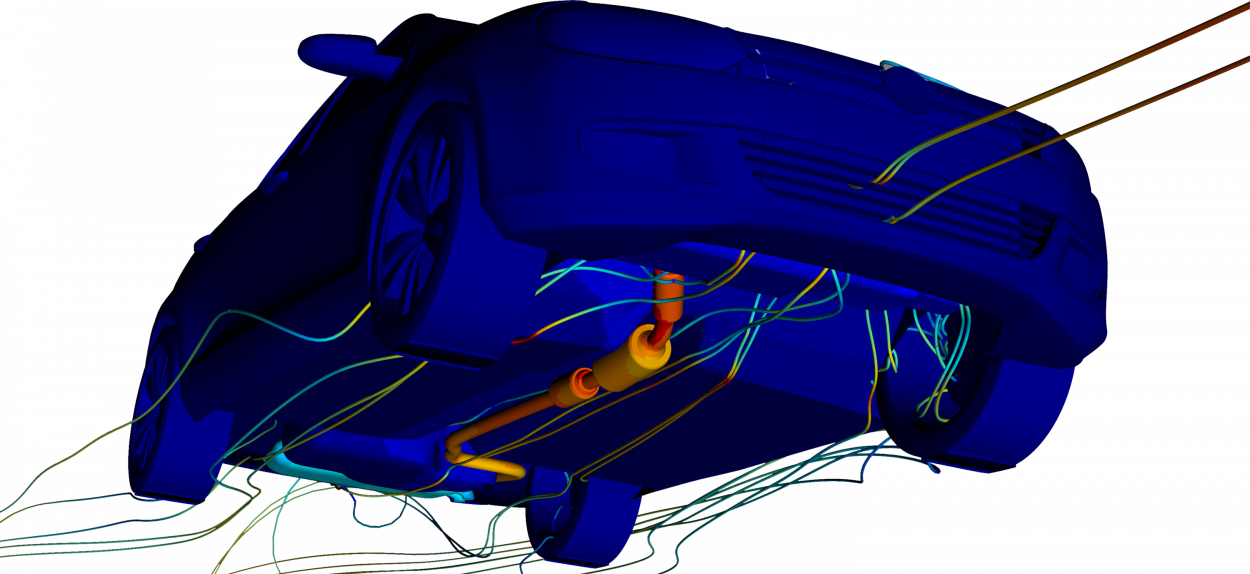
We know that the life of a brake system is transient. That's why we utilize an advanced simulation method that can model a variety of real-world scenarios. Transient thermal simulation allows us to provide you with accurate temperature predictions for even the most complex driving scenarios. We can help you answer tough questions regarding component thermal management, cooling strategies, and brake fluid temperature predictions. Simulation results including, surface temperatures, volumetric solid temperatures, and air temperatures can be analyzed across different designs or use cases.
Coupling Solutions for Advanced Simulations
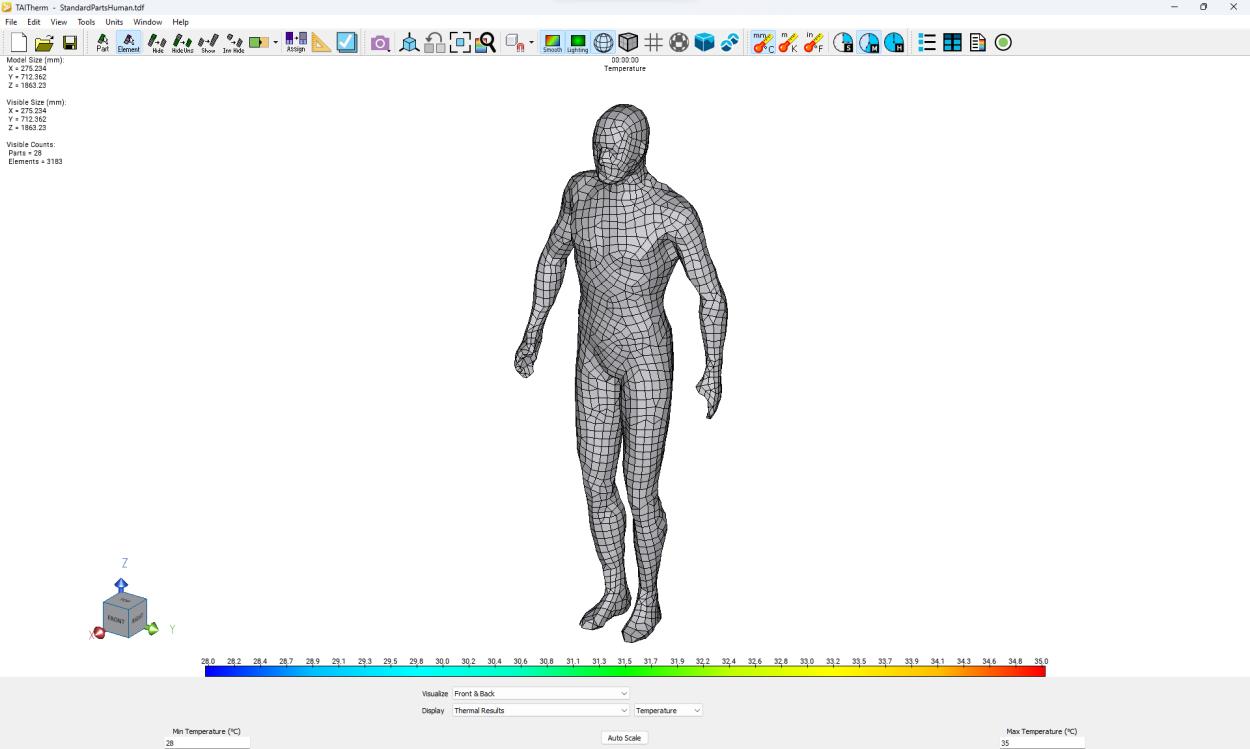
For thermal questions, we use our fast, transient thermal solver, TAIThermTM. For more complex analyses, we often couple our thermal software to industry-standard CFD or 1D tools depending on the problem you're looking to analyze. We also utilize our Drive Cycle Extension for particularly advanced examinations—this method uses surrogate models to speed up a simulation for long and highly dynamic driving profiles, such as frequent stop/start scenarios or real-world driving profiles.
Meet Your Brake Design Goals
Our team of engineers is ready to help you meet your brake thermal management goals on budget, on time, and with actionable simulation data for design optimization.
You Might Also Be Interested In:
Optimize Occupant Comfort
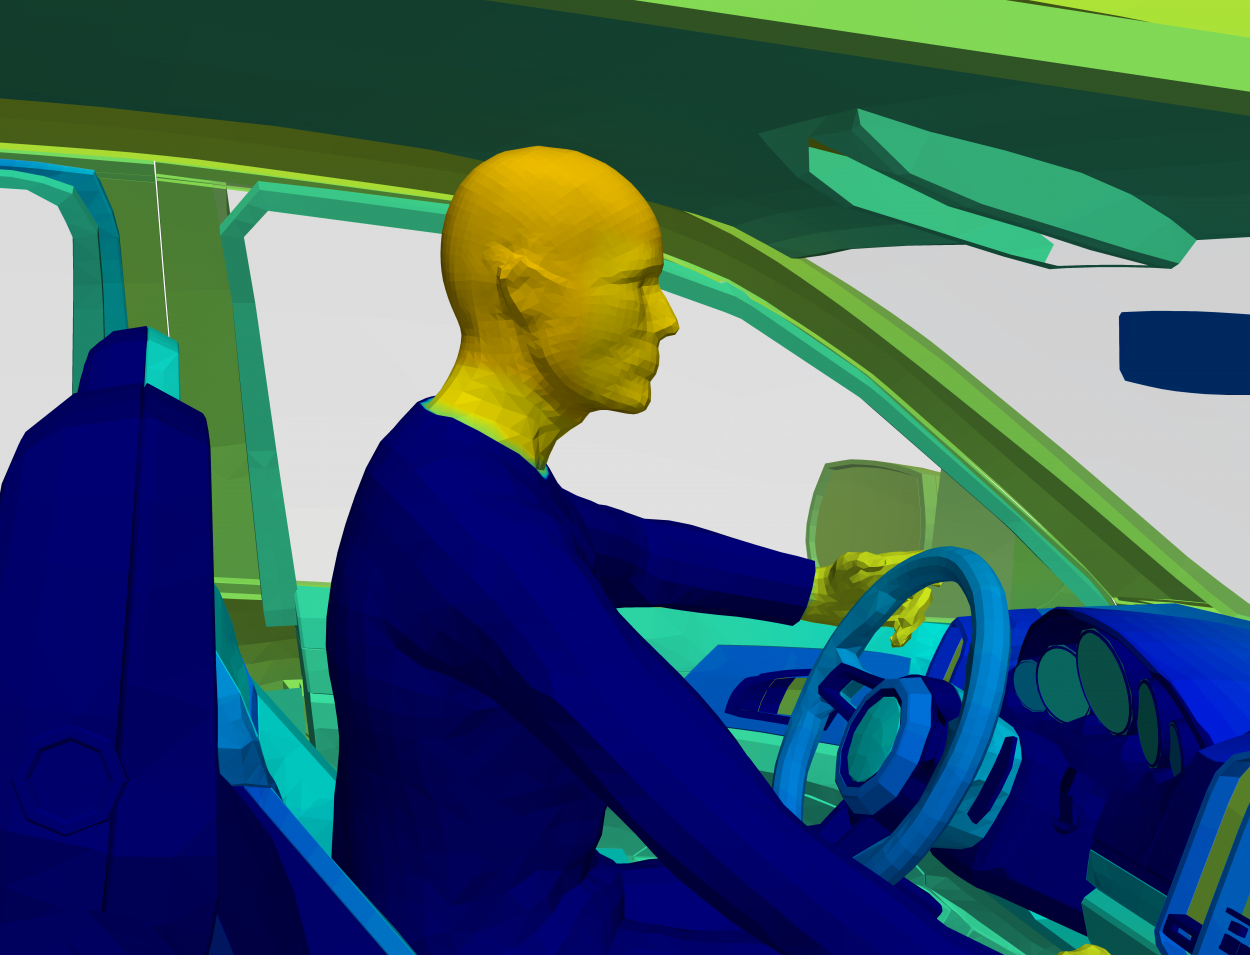
Because of the time spent in homes, offices, and vehicles traveling between the two, the automotive, architecture, and aerospace industries are all attempting to reach optimal occupant comfort for the utmost satisfaction of their customers. Our expert engineers have the knowledge and skills you need to predict cabin comfort and determine HVAC efficiency for your comfort strategies. They'll help you analyze localized heating and cooling, HVAC systems, and human sensation and comfort to ensure your customer's comfort.
Accurate Comfort Predictions
Simulating human thermal comfort will provide the information needed to optimize the user experience and ensure product acceptance.
Our engineers can help you create a thermal simulation using TAIThermTM with the Human Thermal Extension. This will help you understand how altering the variables of your design affects the overall comfort of the human within your design.
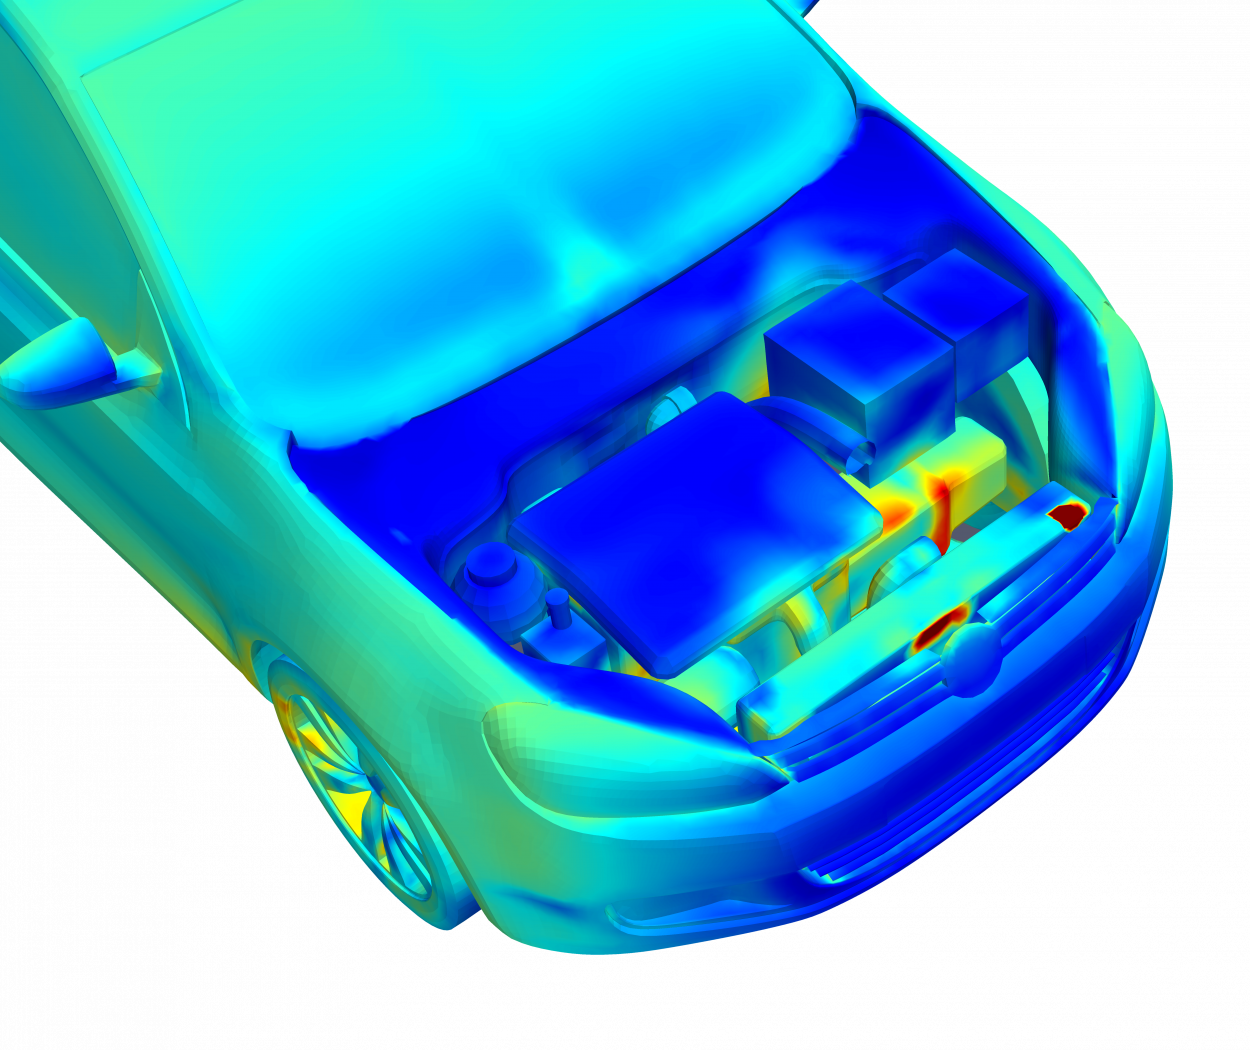
Manage Complex Thermal Challenges
Our team utilizes advanced simulation tools to provide you with fast and accurate data and simulations for transient or steady-state cases for real-world scenarios. We use TAITherm with the Exhaust Extension to quickly create an underbody/exhaust or underhood model that considers the unique physics that the components undergo in cases including hill climbs, trailer towing, hot soaks, or driving cycles. Our method utilizes all modes of heat transfer, so you never miss a thermal interaction.
Getting Started
Let's talk
If you would like to learn more about our Brake Thermal Modeling service and how it can provide you with an actionable design direction, reach out! We will demonstrate how our software will fit your specific requirements and help you understand what you will need to begin simulating your brake designs.
Support
We are here to work with you at every step. We support our customers throughout your service project with excellent communication; we are only a phone call or email away. Our commitment to you never changes.